
Editorial Disclaimer
The views expressed in articles published on FIRES do not necessarily reflect those of IES or represent endorsement by the IES.
By Ian Ashdown, P. Eng. (Ret.), FIES, Senior Scientist, SunTracker Technologies Ltd.
Whether you call it “circadian lighting,” “biologically effective lighting,” or some other name, the principle is the same: the color and intensity of light can be used to regulate the timing of our biological clocks, or “circadian rhythms.” For architects and lighting designers, this is an opportunity to provide healthy and comfortable environments for building occupants.
From an academic perspective, circadian lighting represents the culmination of over two decades of research into the effects of light on circadian rhythms. While there remain a number of open questions and ongoing research to address them, it has been argued that we now know enough to translate this knowledge into practice with building code standards and recommended practices for architectural lighting design.
From an engineering perspective…not so fast.
WELL Building Standard
The WELL Building Standard is dedicated to the concept of building designs that promotes healthy environments for living, working, learning and play (WELL 2019). One of its hundreds of design guidelines is Feature 54, Circadian Lighting Design.
The underlying concept is simple: predict or measure the Equivalent Melanopic Lux (EML) incident on the vertical plane at the eye level of the occupant. For work areas, the design requirements are then:
- At 75 percent or more of workstations, provide at least 200 EML (including daylight if present) at four feet above the floor facing forward (to simulate the view of the occupant) between the hours of 9:00 AM and 1:00 PM for every day of the year; or
- For all workstations, provide maintained illuminance of at least 150 EML on the vertical plane facing forward.
There are similar requirements for living environments, breakrooms, and learning areas.
Unfortunately, architectural lighting design programs such as Lighting Analysts’ AGi32 and DIAL’s DIAL Evo do not predict EML. They do, however, predict photopic vertical illuminance, EV. All the designer has to do then is to calculate or measure EV values and multiply them by the melanopic ratio, R.
How do you calculate this ratio? Well, here are the instructions from Table L2 of Feature 54:
- “To calculate the melanopic ratio of light, start by obtaining the light output of the lamp at each 5 nm increment, either from [the] manufacturer or by using a spectroradiometer. Then, multiply the output by the melanopic and visual curves given below to get the melanopic and visual responses. Finally, divide the total melanopic response by the total visual response and multiply the quotient by 1.218.”
The International WELL Building Institute helpfully provides a downloadable Excel spreadsheet to perform these calculations, which includes six sample spectra for common light sources. Easy!
Once again from an engineering perspective, however…not so fast.
Questions, questions…
The WELL Building Standard, or at least Feature 54, appears to suffer from a lack of understanding of how architectural lighting design is performed in practice. For example:
- Unlike measurements of horizontal illuminance (EH), vertical illuminance (EV) measurements require both a specified position and a direction for the meter sensor. Four feet above the floor to “simulate the view of the occupant” makes sense, but how should “facing forward” be interpreted? What does “forward” mean, and where exactly is the occupant?
- For whatever reason, obtaining the spectral power distributions (SPDs) of luminaires from the manufacturer is in most cases all but impossible. This may change in the future as lighting design and analysis software programs become capable of utilizing this information directly, but for now it is mostly necessary to either manually digitize the manufacturers’ printed datasheets or measure representative products with a spectroradiometer.
- Handheld spectroradiometers for field measurements are available, but they typically have a spectral resolution of 8 to 10 nm. They may report spectral power distributions in 5-nm or even 1-nm increments, but these are interpreted values. Depending on the light source (including particular fluorescent lamps and LED modules with “spiky” distributions), the calculation of equivalent melanopic lux from EV measurements may be insufficiently accurate. Following CIE recommendations for spectral metric calculations, a spectral resolution of at least 5 nm is required (CIE 2004).
- For workstations, what about the computer display monitors that the occupants will presumably be facing for most of the workday? With luminances in the range of 250 to 350 cd/m2, display monitors provide considerably more retinal illumination than the surrounding cubicle walls do, and they further have SPDs similar to white light LEDs of 6500 K. If anything, they likely contribute more to the circadian lighting as perceived by the workstation occupants than the room lighting does. If they are to be considered, how should they be modeled? More important, what is their angular subtense in the occupant’s field of view? A 27-inch display fills much more of the occupant’s field of view than does a 17-inch display, for example.
- Allowing daylight to be included in the predictions or measurements of vertical illuminance does not make sense. The amount of daylight entering an interior workspace depends on the time and date, the building orientation and windows configuration, the sky condition (clear to overcast), the glazing transmittance, whether the blinds are open or closed, and the office partitions and furniture layout. Moreover, what is the SPD of the daylight on clear and overcast days? Also, in modeling daylight, this should include the daylight diffusely reflected from the exterior ground, as it typically comprises some 10 to 20 percent of the daylight entering the space on overcast days.
- How should multiple light sources, each with its own SPD, be modeled? The occupant’s position and orientation at a “typical” workstation might include, depending on the time of day, direct sunlight, diffuse daylight, direct illumination from overhead luminaires, and indirect light from possibly colored surfaces that are illuminated by both overhead luminaires and a desk lamp. It is all but impossible to predict the contributions to the vertical illuminance of these light sources, let alone calculate the resultant composite SPD as seen by the observer.
To put these questions into context, imagine the WELL design requirements being incorporated into Section 16500 clauses of a building specification contract document. It is one thing for an engineer or lighting designer to follow the WELL requirements as guidelines and feel comfortable in saying that the design is compliant; it is quite another when a contractual dispute arises or a building inspector decides to take in situ measurements. From a legal perspective, such ambiguities in the specifications are definitely not a good thing.
Circadian Stimulus
UL is currently preparing a “recommended practice” for circadian lighting (UL 2019) that is based on the Circadian Stimulus (CS) metric developed by Rensselaer Polytechnic Institute’s Lighting Research Center (Rea et al. 2005). At the time of writing, this document is under review, and its contents may change upon publication. However, it can be reported that it relies on the LRC’s CS Calculator, a web-based tool for converting predicted or measured vertical illuminance values into CS metric values.
Unlike the WELL spreadsheet, the CS Calculator offers close to 200 different lamp SPDs for the designer to choose from. If, for example, you are interested in 3500-K LED light sources, there are nineteen SPDs to choose from, while for 4000-K LEDs there are twenty, and eight for 5000 K … and therein lies a problem. For the designer, how do you choose?
Like the WELL’s EML metric, the CS metric is calculated from predicted or measured vertical illuminances, with minimum recommended CS values for different situations. If, for example, the design requires a CS value of 0.30, the designer chooses a light source from the list of options (or provides a custom SPD with 5-nm resolution); the calculator then determines the vertical illuminance needed to achieve this value.
The problem is that even with the same correlated color temperature, the range of required vertical illuminances for the different LEDs is shocking (see Figure 1).
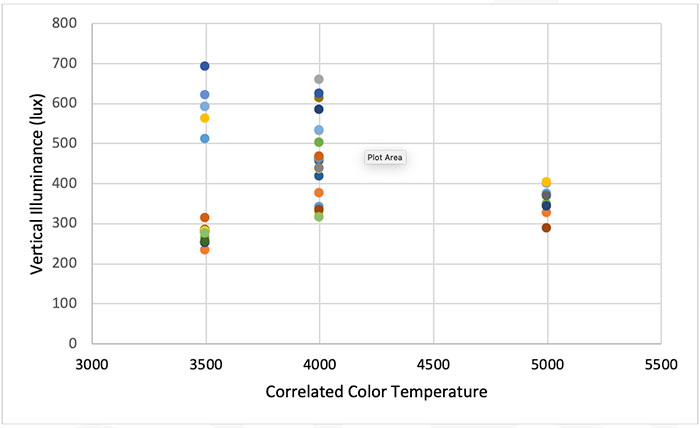
To be fair, some of these LED light sources are unconventional, including violet-pump LEDs (approximately 415 nm) with triphosphor coatings, and hybrid white-light LEDs combined with deep-red LEDs to boost the CRI R9 values. However, there is nothing to stop the designer from randomly choosing one of these products as a “typical” LED light source for calculation purposes.
If nothing else, Figure 1 makes one point perfectly clear: there is no reasonable relationship between CCT and the CS metric, at least for 3500-K and 4000-K LEDs. The range of vertical illuminances for 3500-K LEDs is 3:1, while that for 4000-K LEDs is 2:1. Randomly choosing an LED product as representative of all LEDs with the same or similar CCT could lead to disastrous consequences.
Compared to the 3500-K and 4000-K LEDs, the range of vertical illuminances for 5000-K LEDs is quite small—only ±9%. The reason for this is that the eight LEDs appear to have almost identical SPDs above 500 nm, which is entirely due to the yellow-emitting phosphor blend. The only significant differences are the peak wavelengths of the blue-pump LEDs, which vary from 440 to 450 nm. This situation could, however, change with future developments in LED and phosphor technologies.
It gets worse—what if the building specification permits “or equal” substitutions for luminaires? The CS metric value depends on the absolute spectral irradiance incident on the observer’s retina, and so the luminaire product specification sheet would have to provide a graph of EV versus CS. Further, depending on the EV tolerance the designer is willing to accept, many more products may be disqualified compared to evaluation on luminous flux alone. As any experienced commercial electrical engineer will attest, this can lead to rather heated discussions between the engineering and architectural firms or with the electrical contractor.
It gets worse again—the CS Calculator allows the designer to specify multiple light sources and combines their SPDs into a composite SPD as seen by the occupant. However, it is left as an exercise for the designer to calculate the relative contribution of each light source—including indirect light from possibly colored surfaces in the office space or wherever (and not to mention daylight)—to any predicted vertical illuminance. It is possible to do this with existing architectural lighting design programs, but only if the designer is willing to model and calculate the spatial light distribution in the environment separately for each type of light source. Worse, these programs do not take light source SPDs into account apart from their CCTs, so the results would be at best approximate.
EML versus CS
This is for the CS metric—what about the EML metric? Fortunately, the CS Calculator provides relative SPDs for each of its light sources, with resolution of 2 nm. Rescaling these SPDs to 5-nm resolution and using the WELL spreadsheet produces the melanopic ratios (R) shown in Figure 2.
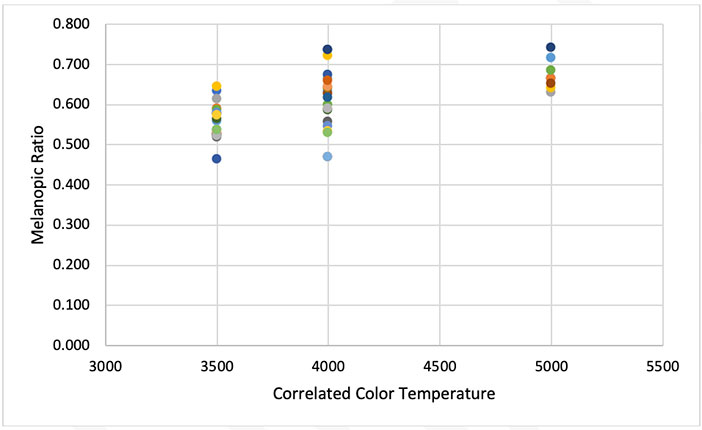
There is still a 60 percent variation in the EML values for a given vertical illuminance value for LEDs of 4000K. This may be preferable (from an engineering perspective) to the 3:1 variation for the CS metric, but it is still an unreasonably wide range for lighting design purposes. It also begs the question: what are the criteria for choosing either the WELL or CS metrics apart from tolerances? Which circadian lighting metric better represents the effect of the lighting on circadian rhythm entrainment?
Summary
We may now “know enough” about the effects of light on our circadian rhythms to design circadian lighting. Whether this is true is debatable, but it is also beside the point. From an engineering perspective, it is abundantly clear that we do not have the calculation tools needed to predict or measure circadian lighting metrics, including EML and CS, to acceptable engineering standards.
For reference, it is generally accepted that architectural lighting design software is capable of predicting horizontal and vertical illuminance values to within 10%, given reasonably accurate surface colors and reflectance values. With circadian lighting metrics, however, we are confounded by the variations between different LED products with the same CCT.
We are further confounded by what exactly it is we are expected to predict with our lighting design software or measure in the field. This is not something that any standard or recommended practice can ever hope to reasonably address—there are simply too many variables.
Regardless of what we may know about the effects of circadian lighting on human health and wellbeing, we may never be able to codify this knowledge in building design practices.
Addendum
The above arguments have been made strictly from an engineering perspective, if only because this author does not have formal training and accreditation in biomedical research. This does not, however, preclude the author from making some rather pointed comments from an engineer’s perspective:
- The CS model was published in 2005, with the abstract reading: “The proposed model offers a framework for hypothesis testing.” Further statements include, “Again, we are limiting our predictions to those data most suitable for testing the model” and “… but clearly, there are insufficient data to resolve this feature.” The authors conclude with, “The proposed model simply deals with characterizing the photopic input to the circadian system, not its subsequent effects on the wide range of biological responses that could be measured (e.g., phase shifting, core body temperature, alertness).”
These statements are perfectly acceptable in an academic paper that specifically introduces “a framework for hypothesis testing.” However, the CS model is now being proposed as the basis of a UL Recommended Practice. Again from an engineering perspective, a much greater burden of proof must be placed on such a proposal beyond that of a hypothetical model.Google Scholar reports 294 citations of the 2005 paper, but almost 100 of these are self-referential. Of the remainder, this author was unable to identify any research studies that are explicitly independent validations of the model. If there were, you would at least expect some modifications, if not to the equivalent electrical circuit representing the model, then at least some updating of the seven particularly precise parameters presented in the original 2005 paper, to better fit academic research results published in the past 14 years.
- This author recognizes and accepts the central thesis of the CS model that spectral opponency is a reasonable hypothesis for phototransduction and (although not explicitly stated in the paper) circadian rhythm entrainment. The author’s reasoning is that spectral opponency in circadian rhythm responses has been observed in a wide range of animals and plants (e.g., Brown 2016, Craig and Runkle 2013, Roenneberg and Foster 1997, Smith 2000, Sweeney et al. 2011, and Walmsley et al. 2015). However, data from animals and, particularly, from plants show that these responses are gated by changes in sky color at dawn and dusk. With plants, this has been shown to be directly related to sensing by phytochromes and cryptochromes, which in turn result in bursts of gene expression.
It is therefore not unreasonable to assume that human circadian rhythms are also influenced by these changes in sky color, for which temporally modulated spectral opponency makes sense. Unfortunately, Rea et al. (2005) explicitly state: “One caveat, however, is the assumption that the spectral sensitivity of the circadian system does not change with circadian time.” In view of the research done on the circadian rhythm entrainment of other animals, it could be argued that the CS model may be incomplete. As but one example, a chronobiological approach to neonatal care explicitly recognizes the importance of the light/dark cycle (McKenna and Reiss 2016).
Given the above, this author is frankly skeptical of the CS model being the result of what we currently know in circadian lighting research.
Similar misgivings might be expressed about WELL’s reliance on the 2014 paper “Measuring and Using Light in the Melanopsin Age,” and its related Irradiance Toolbox, which was published in 2013 and explained in Lucas et al. 2014. After six years, has nothing occurred in circadian rhythm research that might possibly update this model?
Other circadian lighting metrics have been published (e.g., Barroso et al. 2014, Bellia and Bisegna 2013, Gail and Bieske 2004, and Konis 2017). However, this author is even more skeptical of the usefulness of these metrics in predicting circadian rhythm entrainment, which is the putative goal of circadian lighting. In particular, the papers’ authors appear to be mostly from the lighting and architectural communities, with no particular expertise in biomedical research. Given the extensive research that has been conducted in the past five years alone, any proposed metric basically requires a full and complete understanding of the related and current biomedical literature.
From an engineering perspective, it would be comforting if someone from the academic community would publish a peer-reviewed overview paper of existing circadian lighting metrics in a respected biomedical research journal, with a particular emphasis on the current research and whether these metrics properly reflect this research. It is almost nonsensical to rely exclusively on research that is five to fifteen years old.
This, however, may be a moot point. Without some reasonable means of applying a circadian lighting metric in engineering situations, it will remain in essence an academic exercise. Instead, we should simply educate designers on the principles of circadian lighting and trust their judgement.
References
Barroso, A., et al. 2014. “Metrics for Circadian Lighting for Clinical Investigations,” Lighting Research & Technology 46:637-649.
Bellia, L., and F. Bisegna. 2013. “From Radiometry to Circadian Photometry: A Theoretical Approach,” Building Environment 62:63-68.
Brown, T. M. 2016. “Using Light to Tell the Time of Day: Sensory Coding in the Mammalian Circadian Visual Network,” J. Experimental Biology 219:1779-1792.
CIE. 2004. CIE 15:2004, Colorimetry, Third Edition. Vienna, Austria: Commission Internationale de l’Eclairage.
Craig D,S., and E. S. Runkle. 2013. “A Moderate to High Red to Far-red Light Ratio from Light-emitting Diodes Controls Flowering of Short-Day Plants,” J. Americam Society of Horticultural Scientists 138:167–172.
Gail, D, and K. Bieske. 2004. “Definition and Measurement of Circadian Radiometric Properties,” Proc. CIE Symposium of Light and Health – Non-visual Effects. Vienna, Austria: Commission Internationale de l’Eclairage.
Konis, K. 2017. “A Novel Circadian Daylight Metric for Building Design and Evaluation, “Building and Environment 113:22-38.
Lucas, R. J., et al. 2014. “Measuring and Using Light in the Melanopsin Age,” Trends in Neuroscience 37(1):1-9.
McKenna. H., and I. K. Reiss. 2018. “The Case for a Chronobiological Approach to Neonatal Care,” Early Human Development 126:1-5.
Rea, M. S., et al. 2005. “A Model of Phototransduction by the Human Circadian System,” Brain Research Reviews 50:213-228.
Roenneberg, T., and R. G. Foster. 1997. “Twilight Times: Light and the Circadian System,” Photochemistry and Photobiology 66(5):549-561.
Smith, H. 2000. “Phytochromes and Light Signal Perception by Plants – An Emerging Synthesis,” Nature 407:585-591.
Sweeney, A. M., et al. 2011. “Twilight Spectral Dynamics and the Coral Reef Invertebrate Spawning Process,” J. Experimental Biology 214:770-777.
UL. 2019. UL RP 24480, Recommended Practice and Design Guideline for Promoting Circadian Entrainment with Light for Day-Active People. (In public review.) Northbrook, IL: Underwriters Laboratories Inc.
Walmsley, L., et al. 2015. “Colour as a Signal for Entraining the Mammalian Circadian Clock,” PLoS Biology 13(4):e1002127.
WELL. 2019. The WELL Building Standard v2 with Q1 2019 Addenda. New York, NY: WELL Building Institute.