
Editorial Disclaimer
The views expressed in articles published on FIRES do not necessarily reflect those of IES or represent endorsement by the IES.
By Travis Longcore
From the position of wildlife, the best artificial light at night is no artificial light at night. Recognizing that this is not feasible while maintaining safety and achieving other goals, I have focused on evaluating spectrum as an approach to minimizing impacts to wildlife and, more broadly, to the night sky, ecosystems, and humans. The most useful information needed to compare the effects of one light source with another is the spectral power distribution (SPD) from ultraviolet to infrared. By comparing the visual systems or known behavioral responses of different groups and species of wildlife to those SPDs, we can first predict, then confirm through experiments in the laboratory and field, the extent to which one light affects species more or less than another at the same brightness as perceived by humans. My colleagues and I have tested this approach with insects (Longcore et al. 2015; Donners et al. 2018) and seabirds (Longcore et al. 2018) and published this approach to rapid assessment of different lamp sources (Longcore et al. 2018). Although we did provide the code for designers to bring their own SPDs and be able to produce these assessments with just a web browser and a server (see https://github.com/herf/ecological), there is still a widespread desire to allow another metric of spectral characteristics to stand in for full analysis using a light source’s spectral power distribution.
Our previously preferred metric for describing light’s spectral characteristics was CCT, which is falling out of favor (Galadí-Enríquez 2018). The correlation between CCT and our composite wildlife impact estimate using a database of 25 light sources is 0.62, which is adequate but not outstanding. Other possible metrics have been proposed, given existing discomfort with CCT within the lighting community. Metrics that have been suggested include the percentage of visible light below a threshold such as 500 or 530 nm, the melanopic response (the sensitivity of the human intrinsically photosensitive retinal ganglion cell to an increase in illuminance [lux] from the test light source as a percentage of its sensitivity to an equal increase in illuminance from D65 light), as implemented in Longcore et al. (2018), and the ratio of melanopic to photopic light (M/P value) (for discussion of calculation, see Miller and Irvin 2020). The usefulness of these metrics as proxies for the impacts on wildlife has not yet been assessed.
To compare these different approaches, I used the database created for Longcore et al. (2018) and updated it with some additional light sources and metrics (M/P value and percentage of light below 530 nm). I then compared each of the metrics against our wildlife index (a composite) and the four components of the index (insects, juvenile salmon, Newell’s shearwater [a seabird], and an average of sea turtle responses).Please note that the ultraviolet range is only considered down to 350 nm.
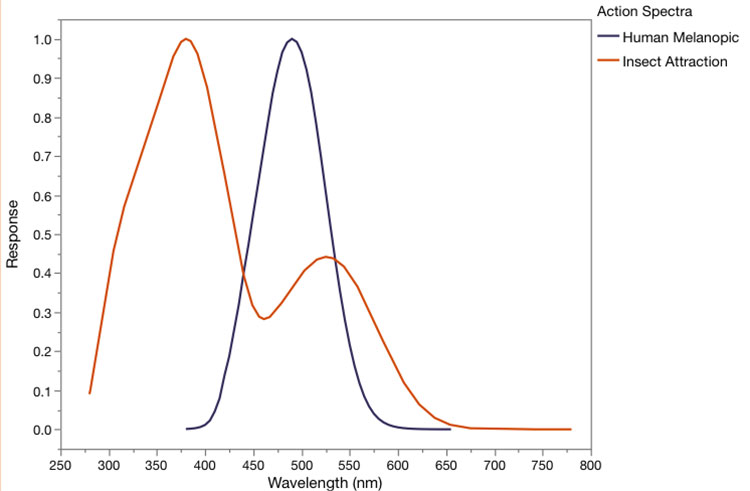
The melanopic response and M/P value perform best in predicting the composite wildlife impacts, but for the components, CCT was better for insects and M/P was better for Newell’s Shearwater (Figure 1). If our database included lights that had violet or near-ultraviolet emissions, the melanopic response and M/P value would fail to identify the impacts of these shorter wavelengths on insects, because the insect action spectra indicate high response to shorter wavelengths, where the melanopic response is approaching zero (Figure 2).
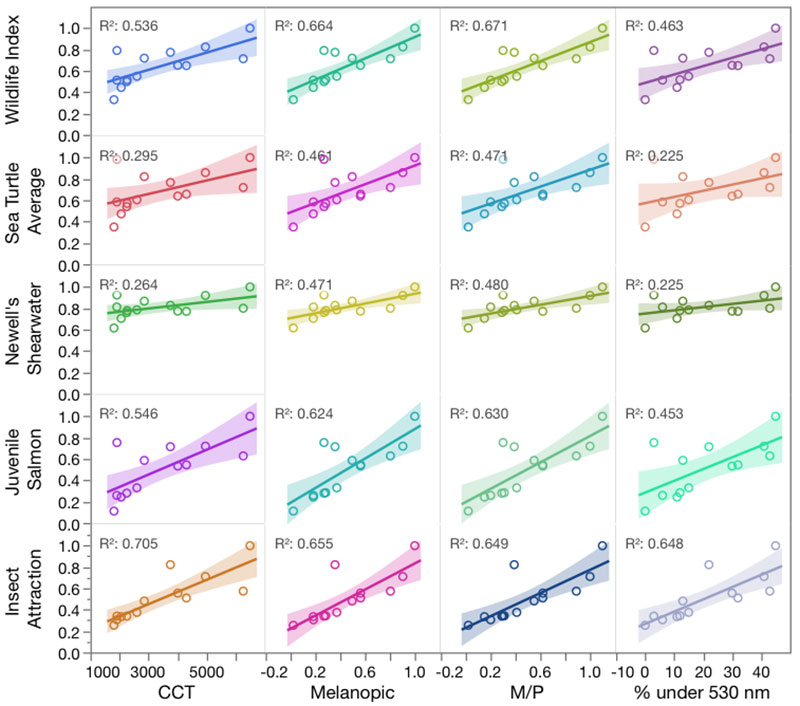
This analysis is limited in two ways, as was our underlying paper. It could benefit from adding more SPDs on the one hand, and even more so by the addition of additional response curves for wildlife. The latter is the subject of ongoing work, and as the database of wildlife behavioral responses is expanded, conclusions about the best summary metric to explain them might also. As it currently stands, however, the M/P value or the melanopic response compared to D65 are reasonable stand-ins for more-detailed analysis of wildlife impacts for sources without violet or ultraviolet.
Based on these results, I recommend that efforts to minimize effects of stray light on wildlife strive to use lamps with the lowest CCT, melanopic response, or M/P value possible to achieve the goals of the lighting project. Neither the M/P value nor the melanopic response can be used to evaluate effects on insects, however, because any light source that avoids the peak of the melanopic response by using shorter wavelengths (e.g., a violet LED pump) will be extremely attractive to insects. Adjusting spectrum is not a panacea, and other tools for reducing adverse impacts should be considered: light only when needed; light only as brightly as needed; direct lights where needed; and reduce intensity or switch off when possible (Gaston et al. 2012; Longcore and Rich 2017).
Acknowledgements
Constructive comments from Ian Ashdown and Naomi Miller improved this note. The work builds on many conversations and collaboration with Michael and Lorna Herf.
Literature Cited
Donners, M., R. H. A. van Grunsven, D. Groenendijk, F. van Langevelde, J. W. Bikker, T. Longcore, and E. Veenendaal. 2018. Colors of attraction: modeling insect flight to light behavior. Journal of Experimental Zoology Part A: Ecological and Integrative Physiology 329:434–440.
Galadí-Enríquez, D. 2018. Beyond CCT: The spectral index system as a tool for the objective, quantitative characterization of lamps. Journal of Quantitative Spectroscopy and Radiative Transfer 206:399–408.
Gaston, K. J., T. W. Davies, J. Bennie, and J. Hopkins. 2012. Reducing the ecological consequences of night-time light pollution: options and developments. Journal of Applied Ecology 49:1256–1266.
Longcore, T., H. L. Aldern, J. F. Eggers, S. Flores, L. Franco, E. Hirshfield-Yamanishi, L. N. Petrinec, W. A. Yan, and A. M. Barroso. 2015. Tuning the white light spectrum of light emitting diode lamps to reduce attraction of nocturnal arthropods. Philosophical Transactions of the Royal Society B-Biological Sciences 370:20140125.
Longcore, T., and C. Rich. 2017. Artificial Night Lighting and Protected Lands: Ecological Effects and Management Approaches (Revised August 2017). Natural Resource Report NPS/NRSS/NSNS/NRR—2017/1493. National Park Service, Fort Collins, Colorado.
Longcore, T., A. Rodríguez, B. Witherington, J. F. Penniman, L. Herf, and M. Herf. 2018. Rapid assessment of lamp spectrum to quantify ecological effects of light at night. Journal of Experimental Zoology Part A: Ecological and Integrative Physiology 329:511–521.
Lucas, R. J., S. N. Peirson, D. M. Berson, T. M. Brown, H. M. Cooper, C. A. Czeisler, M. G. Figueiro, P. D. Gamlin, S. W. Lockley, and J. B. O’Hagan. 2014. Measuring and using light in the melanopsin age. Trends in Neurosciences 37:1–9.
Miller, N. J., and A. L. Irvin. 2020. M/P ratios–Can we agree on how to calculate them? , FIRES Forum [Illuminating Engineering Society], New York.