

A look at two barriers to TM-30 use and how to master them
By Tony Esposito and Jess Baker
Before the advent of LEDs, light sources—such as incandescent, linear fluorescent, metal halide, high-pressure sodium, etc.—had limited spectral flexibility and a lighting practitioner could develop an internal sense of the color appearance of objects under the few sources that were commercially available. CRI may have been “good enough,” since it was largely a supplement to an experienced specifier’s knowledge of existing sources. To the lighting industry, LEDs have brought increased spectral diversity and with that a need for performance measures to evaluate and differentiate products. In most cases, a single-measure specification is insufficient. To harness the full potential of LEDs, an expanded specification framework is needed.
That expanded framework is ANSI/IES TM-30, IES Method for Evaluating Light Source Color Rendition. TM-30 has many potential benefits—including increasing the efficient pairing of a light source spectrum with the intended application—though many specifiers in the industry still lean heavily on CRI. In this article we identify two barriers of TM-30 use and offer suggestions for how lighting practitioners might overcome them.
Barrier 1 – Complexity
Obstacle: TM-30 feels complicated.
Remedy: To combat complexity, we offer this important central idea: all measures of color rendition are relative. That is, they tell us something about our light source relative to a standardized reference illuminant (the reference illuminant is a smooth, broadband light source at the same CCT). Memorize this idea and navigating the world of color rendition is much simpler. Through this lens, we offer simplified descriptions of the four main measures of TM-30 that can serve as your North Star:
- Rf: Average Fidelity – the average deviation from the source’s reference illuminant. It only indicates the magnitude of the difference, not the direction (direction is important because it tells us about hue shift and saturation of colors). Higher is closer to the reference illuminant, which may not necessarily be better for the intended application.
- Rg: Average Gamut Area – the average increase or decrease in chroma relative to the source’s reference illuminant. Contains no information about specific hues (colors).
- Rcs,h1: Local Chroma Shift Hue Bin 1 (Red) – indicates the specific increase or decrease in chroma (higher is more vivid), relative to the source’s reference illuminant, for red hues.
- Rf,h1: Local Color Fidelity Hue Bin 1 (Red) – indicates the specific magnitude (not direction) of deviation, relative to the source’s reference illuminant, for red hues. Does not indicate direction (i.e., hue or saturation).
Armed with these four measures, specifiers can use TM-30 Annex E “PVF” specification categories to simplify and expedite the specification process. “P” is for “preference,” “V” is for “vividness” and “F” is for “fidelity.” Here is a four-step process for determining your PVF specification. The design intents are described in the Annex E table reproduced here for quick reference. If reading in print, please cut this out and hang it up!
- Step 1: Determine the primary design intent(s). Is a single design intent sufficient, or is a combination desired?
- Step 2: Determine the priority level for the design. How important is achieving the desired intent?
- Step 3: Determine criteria using Annex E Table. Where multiple criteria occur, compare criteria, and choose the stricter.
- Step 4: Find light sources. Focus on the metric most important to your goal to narrow your search.
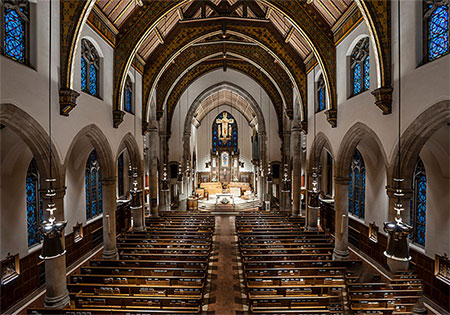
Let’s look at an example: The specifier for a cathedral church feels that using luminaires to boost reddish tones improves the appearance of the prominent warm wood architecture and helps to create a welcoming environment. Using Annex E (Table 1), the specifier for this project set a specification of “P1” preference and a “V3” vividness priority goal. This ensures that this enhancement will be tasteful overall while also making the existing wood look inviting.
Figure 1 shows an illustrative example of this project specified using CRI/R9 (left) vs. TM-30 (right). The “high CRI” approach, at best, would only make the space appear somewhat like it would under a standard reference source. In contrast, the TM-30 spec can accommodate the original rendition goal of the designer: a space that most people will like more. While the “high CRI” design may be acceptable, many will find the increased red saturation and the enhanced wood tones to be more pleasing, especially in a side-by-side comparison. Readers can find a more detailed guide of the Annex E table in the article “Using TM-30 to Improve Your Lighting Design” in the IES FIRES blog.
Barrier 2 – Data Availability Obstacle: TM-30 data is hard to track down. Few manufacturers publish the data while conversely, CRI and R9 are readily available—often indicated in the fixture’s catalog number. Also, change is hard.
Remedy: TM-30 is computed from the same data as CRI/R9 —the SPD curve. Theoretically, anywhere that CRI/R9 information is available, TM-30 information could also be available. If the four main measures are available, such as on a manufacturer’s spec sheet, great. Problem solved. If not, lighting specifiers will need to push for the information required. Here is what to request:
- First, request the TM-30 Full Color Rendition Report. This is a report generated by the IES TM-30 calculator and contains the four measures described above. An example report can be found on p. 24-25 of TM-30 (free download from the IES Webstore).
- If a TM-30 report is not available, request the SPD data. You can compute all TM-30 measures using this data and create your own reports using the IES TM-30 calculator (downloadable with the TM-30 document for free from the IES Webstore).
- If all else fails, request a sample and measure the fixture’s SPD curve using a spectrometer. Many devices that measure SPD also provide TM-30 measurements; if not, extract the SPD data and compute the measures using the TM-30 calculator (see point 2).
SPECIFIERS CAN USE TM-30 to capture the full breadth of the visual experience and replace insufficient and outdated metrics. We hope these remedies help make specifying LED color rendition simpler and reveal the need for readily available information. We recognize that color rendition can be challenging. People with questions can reach out to our IES Color Committee co-chairs: Tony Esposito (tesposito@LightingResearchSolutions.com) or Jason Livingston (jason@studio-tl.com). We are here to help.