Editorial Disclaimer
The views expressed in articles published on FIRES do not necessarily reflect those of IES or represent endorsement by the IES.
By Ian Ashdown, P. Eng. (Ret.), FIES
Senior Scientist, SunTracker Technologies
The phrase déjà vu translates from French as “already seen,” which nicely describes a current issue with horticultural lighting design. The introduction of LED technology may have kick-started horticultural lighting as an innovative industry, but we have yet to learn an important lesson from four decades of architectural lighting.
The Importance of Design Data
Prior to the 1980s, architectural lighting design was more art than science. Electrical engineers needed nothing more than pencil and paper to perform lighting calculations by hand. This all changed, of course, with the introduction of personal computers.
Today’s architectural lighting design software began with simple programs that had a particular problem. Luminaire manufacturers published plots and tables of photometric data for lighting designers, but these were useless for computer calculations.
The Illuminating Engineering Society recognized this problem, and in 1981 introduced a standardized file format for representing photometric data (ANSI/IES 2019). Unfortunately, the initial response of the major luminaire manufacturers was to simply ignore this development.
The argument at the time seemed reasonable enough: the published plots and tables were included in printed catalogs that sales representatives could hand-deliver to their clients. These visits generated sales opportunities that would be lost if lighting designers were able to do computer-aided calculations themselves.
Following this argument, the luminaire manufacturers mostly decided that their product data was proprietary, and that clients would be better served by requesting custom light plans through their sales representatives.
In a word (or two), déjà vu. Four decades later, this is exactly the argument that most horticultural lighting manufacturers are offering.
Failure to Communicate
The decision of architectural luminaire manufacturers to declare their product data as proprietary information was in retrospect a woeful mistake. The capabilities of lighting design software rapidly improved, giving lighting designers and engineers the ability to tackle more challenging projects, and also – critically – to compare the performance of luminaires from different manufacturers.
For lighting sales representatives in particular, it was an increasingly costly mistake. Given a choice between products for which electronic data (stored on floppy magnetic disks) was available and printed tables in catalogs, many lighting designers simply refused to specify the latter. In a competitive market driven by specification sales, this was not good.
Today, architectural luminaire manufacturers provide photometric and electrical data for virtually all of their commercial and industrial products, using industry-standard file formats such as ANSI/IES LM-63 (North America) and EULUMDAT (Europe). This downloadable information is freely and publicly available, and it is fully expected that professional lighting designers will use the data to compare the performance of products from different luminaire manufacturers.
Luminaire Design
The availability of lighting design software with visualization capabilities had a further unexpected effect on luminaire design. In being able to model the distribution of light in complex architectural environments, lighting designers could see where the light needed to go. From this, they could tell their luminaire sales representatives what they needed in terms of product performance.
Luminaire manufacturers responded by designing products with increasingly sophisticated optics, including reflectors, lenses, and holographic diffusers. The introduction of LED technology supercharged this effort because it is much easier to control the light emitted by point sources.
Horticultural Lighting
With this as historical background, it is interesting to look at the current state of horticultural lighting design. At present, not a single horticultural luminaire manufacturer offers publicly available photosynthetic photon intensity distribution (PPID) or spectral quantum distribution (SQD) information for their products. When asked, the explanation is familiar: the information is proprietary, but custom light plan services are available for qualified clients.
“It’s déjà vu all over again,” as the baseball legend Yogi Berra probably never said.
The product information that is generally available from the manufacturers’ catalogs is rather sparse:
- Photosynthetic photon flux (PPF), measured in micromoles per second per square meter;
- Photosynthetic photon efficacy (PPE), measured in micromoles per Joule; and
- Electrical input watts.
This is sufficient to guesstimate the number of luminaires required for a greenhouse or vertical farm, and to calculate the electrical power requirements, but nothing more.
Knowing the SQD (aka the “spectrum”) of a horticultural luminaire is an important issue, as most commercial greenhouse crops have species- and life cycle-specific responses to different SQDs (e.g., ANSI/IES 2021). If available at all, this information is presented either in graphical form in the catalog, or as “red,” “green,” and “blue” PPF values in a printed table.
It has been argued that the horticultural lighting industry does not need any more detailed information than this. While architectural lighting design programs such as Lighting Analysts’ AGi32 and DIAL’s DIALux are capable of performing basic horticultural lighting calculations, few people in the horticultural industry are interested in investing the time and effort needed to master these programs. It makes much more sense for clients to simply request custom light plans from the luminaire manufacturers.
Déjà vu … this is an echo of the arguments advanced in the 1980s, when few architectural lighting designers owned personal computers. In retrospect, telling your clients that you are smarter and more capable than they are is never a good business strategy.
Disruptive Innovation
But now, consider this scenario: A professional lighting designer with computer-aided drafting (CAD) and architectural lighting design software skills is engaged to create a lighting layout for a greenhouse project. Our designer’s first task is to model the greenhouse with its luminaires, such as that as shown in Figure 1.

Having done this, the next task is to calculate the spatial distribution of photosynthetic photon flux density (PPFD) at the height of the plant canopy. Modeling the luminaire PPID is straightforward, as most LED-based horticultural luminaires do not employ optics and so have fully predictable cosine (“Lambertian”) PPIDs (Figure 2). If you know the luminaire PPF, the maximum PPI is PPF/π.

The result is shown in Figure 3, where the PPFD distribution (measured in micromoles per second per square meter) is represented by a “heat map.”

More usefully, the PPFD distribution is shown as an isoPAR plot, as in Figure 4.

A horticulturalist may look at this heat map and realize that the distribution is uneven around the edges, resulting in poor PPFD uniformity. What the lighting designer may not know is that unlike humans, plants are particularly sensitive to differences in PPFD; a rule of thumb is that a one percent decrease in PPFD typically means a one percent decrease in the photosynthetic rate. It may also result in different flowering times for plants arranged around the greenhouse periphery. Obviously, more luminaires are needed closer to the greenhouse walls.
Our architectural lighting designer may see things quite differently. Looking at the heat map, there is clearly a need for horticultural luminaires with optical components – reflectors or lenses – to direct the light where it is needed. In this situation, it would make sense to employ luminaires with asymmetric PPIDs around the greenhouse periphery. There is no point in placing additional luminaires next to the walls if half of their light will simply escape the greenhouse entirely.
Our designer will further recognize that luminaires with “batwing” PPIDs are more efficient in achieving uniformity than today’s Lambertian distributions – the architectural lighting design community has known this for nearly a century (Figure 5). Greater uniformity means that fewer luminaires may be required.

There are at present no asymmetric-distribution luminaires for horticultural applications, and indeed few horticultural luminaires with any sort of optics. Our lighting designer may see this as an interesting business opportunity for a start-up company, possibly leading to disruptive innovation in an already crowded market with products that compete mostly on their PPE performance.
The key here is not any eureka moment on the part of our lighting designer as an industry outsider, but rather the lighting design software and accompanying luminaire optical data that made it possible to visualize the product’s performance (or lack thereof). Without such design tools, architectural lighting designers would still be working mostly with pencil and paper.
Spectral Issues
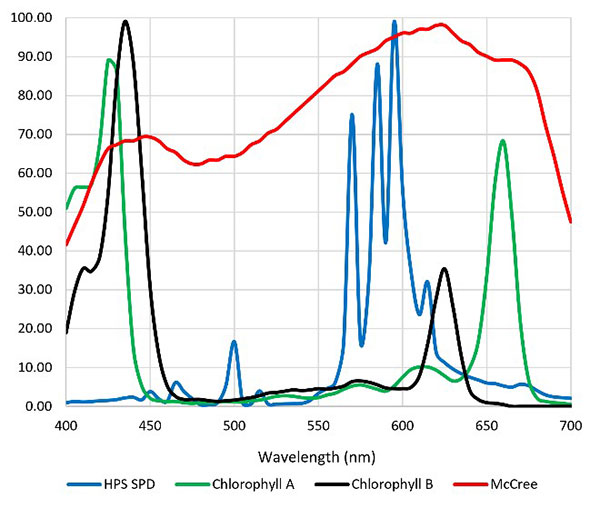
One of the tragedies of today’s horticultural lighting industry is that it is for the most part years behind academic research in terms of plant responses to the light source spectrum from 280 nm (ultraviolet-B) to 800 nm (far-red). As but one example, most luminaire manufacturers until recently offered products with only red and blue LEDs, arguing that their 450 nm (blue) and 660 nm (red) spectral outputs were aligned with the spectral absorptance peaks of chlorophyll A/B, and so would maximize photosynthesis (Figure 6).

The problem with this argument is that the spectral absorptance distribution shown in Figure 6 represents chlorophyll A/B dissolved in a solvent such as ethanol (in vitro) in the laboratory. In the plant leaves (in vivo), the chlorophyll photopigments interact with accessory photopigments such as beta-carotene, resulting in a spectral absorptance distribution for photosynthesis that resembles the McCree curve. (Without this, HPS lamps would have been completely ineffective for greenhouse lighting.)
There are many more examples, including varying the red-to-far-red ratio (R:FR) on a diurnal basis for controlling plant flowering; using green light and UV-A radiation to promote secondary metabolite production; various combinations of blue, red, and yellow light to influence plant morphology … the list goes on (ANSI/IES 2021).
The point here is that luminaire spectra are of interest and potential benefit to horticulturalists. It is not enough to report the luminaire PPF as “red,” “green,” and “blue” quantities, because these colloquial terms are themselves undefined. Instead, horticultural lighting designers will need to know the detailed SQD of each luminaire, if not today then in the near future.
Some luminaire manufacturers have refused to provide any SQD data to their clients, even in graphical form, arguing that it is proprietary and confidential information. This is nonsensical, however, as anyone can measure a luminaire’s spectral output with an inexpensive spectroradiometer. However this data may be used, it will likely be inferior in quality to laboratory measurements performed by the manufacturer. At best, it will poorly represent the product’s performance in comparison with competitor’s products for which laboratory-measured data is publicly available.
DesignLights Consortium
… which brings us, somewhat indirectly, to the DesignLights Consortium (DLC®), a non-profit organization that works with utilities and government agencies to improve the energy efficiency of lighting products, including horticultural lighting, through their Qualified Products List.
The DLC currently has more than 450 listed horticultural products from over 110 manufacturers. Most important, these product listings include PPID and SQD information, exactly what lighting designers will need when working with horticultural lighting design software.
This is the good news; the bad news is that the PPID and SQD information is presented as small on-screen images, with no possibility of downloading the data for lighting design calculation purposes (Figure 7). Déjà vu …

Beginning January 1, 2022, any horticultural luminaires submitted for DLC qualification must include PPID and SQD in ANSI/IES TM-33-18 format. This industry standard was specifically designed to represent optical (including PPID and SQD) and electrical data for horticultural luminaires. Moreover, it is a superset of ANSI/IES LM-63 and EULUMDAT file data.
Unfortunately, these documents will not be made publicly available by the DLC. Instead, they will be used only to generate new PPID and SQD images in a standardized presentation format. Sadly, the PPID and SQD data will remain proprietary until the horticultural luminaire manufacturers change their policies.
An Inevitable Future
Regardless of the current situation, the future of horticultural lighting design is inevitable – luminaire manufacturers will eventually have to provide PPID and SQD data for their products to lighting designers. To do otherwise is to rely on customers who purchase their products exclusively from the manufacturer without comparing their performance to that of their competitors’ products.
Some manufacturers will undoubtedly insist that they offer not only custom light plans with their proprietary data, but the knowledge and expertise of their customer support staff as well. This is a reasonable argument in an industry that is not focused exclusively on lighting design, but it is still a risk. We need only look to the past to see whether this strategy will continue to work in an open market for horticultural luminaires.
References
ANSI/IES. 2018. ANSI/IES TM-33-18, Standard for the Electronic Transfer of Luminaire Optical Data, New York, NY: Illuminating Engineering Society.
ANSI/IES. 2019. ANSI/IES LM-63-19, Approved Method: IES Standard File Format for the Electronic Transfer of Photometric Data and Related Information. New York, NY: Illuminating Engineering Society.
ANSI/IES. 2021. ANSI/IES RP45-21, Recommended Practice: Horticultural Lighting. New York, NY: Illuminating Engineering Society.
Afterword
This article was originally published as a blog posting by the All Things Lighting Association, a non-profit organization whose mission is to “Support and promote innovation, science, and engineering in lighting, including lighting for health, horticulture, architecture, and entertainment.
Figures 1, 3, and 4 were generated by SunTracker Technologies’ Cerise365+GreenHouseDesigner™, a Software-as-a-Service (SaaS) program for horticultural lighting design that is derived from a commercial architectural lighting design program.
This program incorporates parametric models of various greenhouse, hoop house, and vertical farm designs that enable the user to focus on lighting and climate-based daylighting design issues without the need for CAD modeling. It does, however, require PPID and SQD data from the luminaire manufacturers.