Editorial Disclaimer
The views expressed in articles published on FIRES do not necessarily reflect those of IES or represent endorsement by the IES.
By Naomi J. Miller, PNNL; Anne (Lia) Irvin, PNNL
Introduction
The candela and the lumen are units based on one form of human spectral sensitivity, characterized with the weighting function known as V(λ), which was derived under a very narrow set of experimental conditions by multiple researchers, and the results awkwardly combined in 1924 to produce the familiar photopic response function [Sharpe and others, 2005]. As an example, V(λ) indicates a 10-fold lower response in the blue-violet range, compared to photopic sensitivity derived in more recent work [Judd, 1951; Vos, 1978]. Yet, these units are ubiquitous in our modern lighting language and metrics. Alternative sensitivity curves or action spectra can be applied to a lamp or luminaire’s spectral power distribution (SPD) to yield more-relevant measures of color sensitivity, off-axis visibility at night, potential circadian stimulus, potential blue-light hazard, scene brightness [Rea 2015], or even potential for damage to artwork. In the near future, practitioners may need to learn to evaluate SPDs using various weighting functions most pertinent to the application, and to evaluate a lighting system’s energy effectiveness (that is, meeting the needs in a space with minimal energy use) using a different kind of radiant watts per electrical watt [Rea, 2015].
Melanopic/Photopic (M/P) ratios are entering lighting practice as a spectral metric for evaluating the health and wellbeing-related consequences of light, for alertness, relaxation, or sleep, for example. According to some research, the more energy in the spectrum (measured in radiant watts) emitted in the spectral range to which the intrinsically photosensitive retinal ganglion cells (ipRGCs) are most sensitive, the more the light source’s alertness potential. Conversely, for sleep, a low M/P ratio is recommended. The M/P ratio simply compares that melanopic (ipRGC) potential to the light source’s ability to produce light for daytime detail (photopic) vision. This article presents some of the salient issues surrounding the current use of melanopic and photopic weighting functions, specifically addressing the multiple ways the melanopic-to-photopic (M/P) ratio can be calculated, in hopes that the scientific community can settle on a common method—or at the very least, provide multipliers to help researchers and practitioners translate from one method to another.
Before continuing, we offer a quick note on the terminology used in this article and elsewhere in this field. There are few official definitions of these terms.
- Spectral weighting function – A broad term referring to any function that can be used to weight an SPD.
- Spectral efficiency function – A spectral weighting function that has been normalized to a maximum of 1.
- Spectral efficacy function – A spectral efficiency function including a constant multiplier (e.g., 683 lm/W) to adjust the resulting units to an established value.
- Action spectrum – A plot of the rate of physiological activity versus wavelength. This term may sometimes be interchangeable with others.
- Spectral sensitivity – A spectral weighting function typically used to describe photoreceptors, but could be interchangeable with spectral efficiency function or action spectrum.
Background
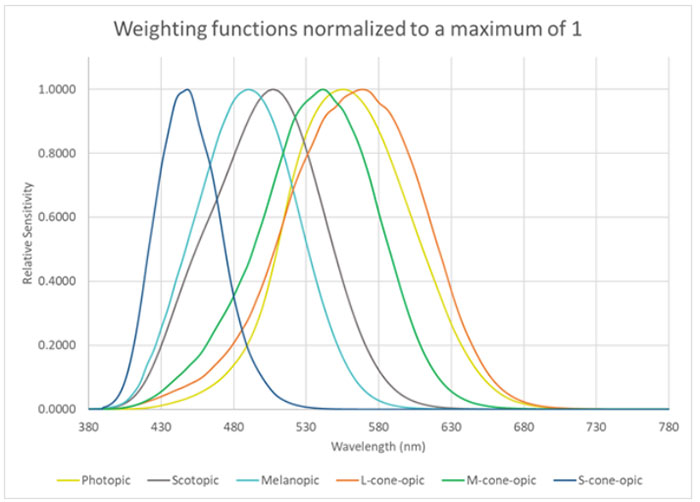
A quick review of the photoreceptors of the human eye is appropriate at this point, as they play an important role in how light is quantified. The cones, responsible for color and detail vision, are concentrated in the fovea, where the central axis of the eye meets the retina. There are three cone types, known as short- (S), medium- (M), and long-wavelength sensitive (L), with peak sensitivities around 440 nm, 545 nm, and 570 nm, respectively. Cone vision is dominant when luminances are above about 5 cd/m2, a condition referred to as photopic vision.
Rods are responsible for vision at low luminances but do not enable seeing color or detail. Scotopic vision is produced through the rod photoreceptors, which have a peak sensitivity at about 507 nm. For more background on rods and cones and their respective visual functioning, see Kolb and others [2017].
In 2002, additional photoreceptors were identified in the human eye [Berson and others 2002; Hattar and others 2002]. Relevant primarily to circadian physiology, pupil dilation, and other nonvisual effects, these photoreceptors are not located at the back layer of the retina, but more forward as part of the ganglion cell layer. Called intrinsically photosensitive retinal ganglion cells (ipRGCs), they operate using a photopigment called melanopsin. For further details, see Lucas and others [2014] or Kolb and others [2017].
The peak sensitivity of ipRGCs in an average 32-year old human is at approximately 490 nm, whereas the raw sensitivity of melanopsin peaks at around 480 nm [Lucas and others 2014; CIE 2015]. The difference stems from the transmittance of the ocular media, which is also considered for the reported sensitivities of other photoreceptors, as well as all experimentally derived visual and nonvisual response functions. The ipRGCs do not directly contribute to image-formation aspects of vision, but are principally responsible for the human body’s neuroendocrine response to optical radiation. Some new evidence suggests that ipRGCs may contribute to brightness perception [Schmidt and others 2011; Schlesselman and others 2015]. Some of this effect might be due to their effect on pupil dilation [McDougal and Gamlin 2010; Lucas and others 2014].
IpRGCs are the fifth photoreceptor identified in the human retina, and their peak sensitivity to light is approximately 480 to 490 nm, a range perceived as blue-cyan; these are longer wavelengths than the 450-nm blue peak that is commonly used for blue-pump LEDs. Figure 1 illustrates the peak and range of relative sensitivity of the five photoreceptors: S-cone, ipRGC (melanopic), rod (scotopic), M-cone, and L-cone, all normalized to a maximum of 1. Superimposed in yellow-green is the V(λ), the photopic sensitivity curve which peaks at 555 nm.
The photopic spectral efficiency function (with a maximum of 1) is multiplied by a maximum value (Km-value, where the subscript m means “maximum”) of 683 lm per radiant W (lm/W) [CIE 1979, 1980], used to calculate photometric quantities such as lumens, illuminance, luminance, and candelas. When the value at each wavelength of this visual efficacy function, is multiplied by the radiant watts at each wavelength of the source SPD, and the results summed, the result is luminous flux in lumens.
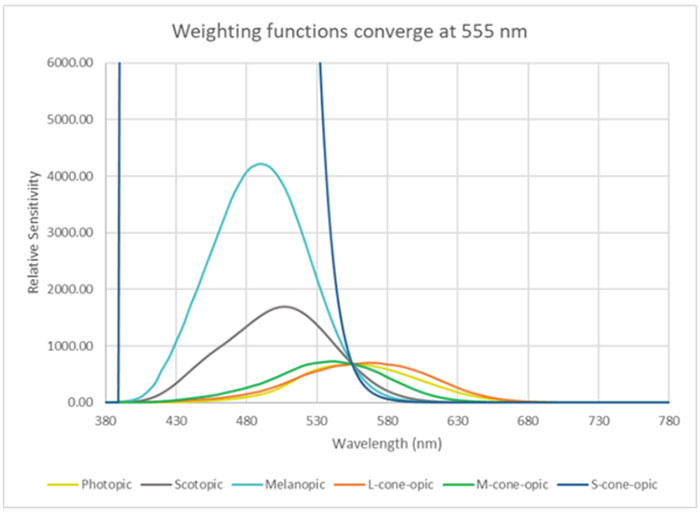
The rods are more sensitive than the cones. The scotopic (rod) luminous efficiency function has a maximum value of 1, but its luminous efficacy function, called V’(λ), has been defined to be equal to that of V(λ) in lm/W at 555 nm. When plotted (see Figure 2), the peak sensitivity of the scotopic luminous efficacy function reaches a maximum value of 1,700 lm/W (Km’=1,700 lm/W) at 507 nm. Scotopic-to-photopic (S/P) ratios have been used in recent decades to quantify from a light source’s SPD how much scotopic content the source delivers, relative to the number of photopic lumens. That S/P ratio is used to estimate how well a source would support nighttime visibility, among other issues.
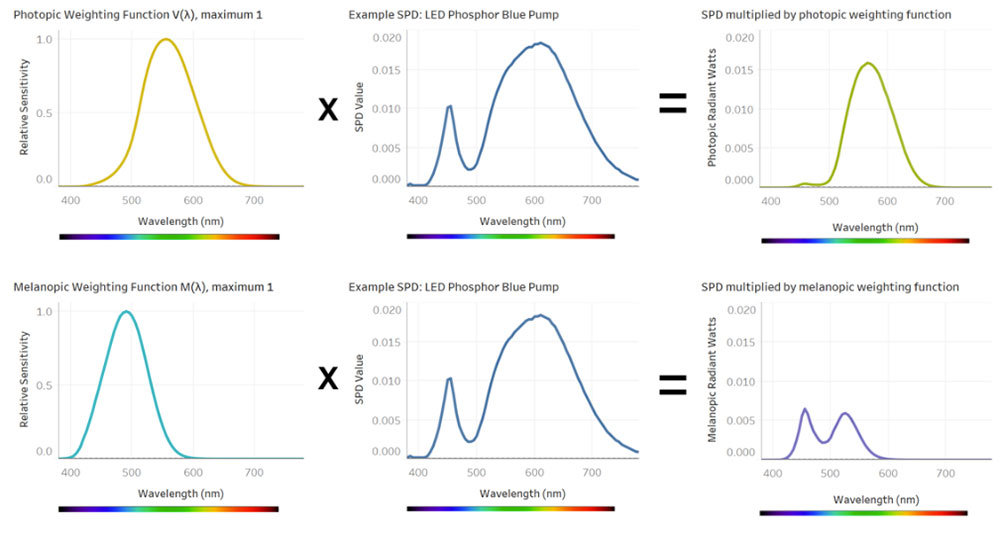
A weighting function works by multiplying each wavelength value of the relative sensitivity curve by the SPD of the light source. Figure 3 shows the resulting weighted spectrum of the SPD from the melanopic sensitivity curve (top) and the photopic sensitivity curve (bottom). Summing all the area under the resulting curve produces melanopically weighted or photopically weighted radiant watts.
M/P ratios
We are seeing more references to M/P ratios, a concept for evaluating the melanopically weighted content of an SPD compared to the photopically weighted content. However, understanding and applying M/P ratios is currently not straightforward, because there are four different methods for calculating this ratio, leading to confusion and lack of comparability. This section steps through each of these four methods, followed by information on how to translate from one method to another. (Note that we use the term “radiant watts” to denote the resulting effective radiant energy of an SPD when it is multiplied by a melanopic or photopic weighting function, as illustrated in Figure 3.)
Method 1 for calculating M/P ratios
If we were to follow the definitions used for S/P ratios above, the melanopic spectral efficiency curve would have a maximum value of 1, but the melanopic spectral efficacy curve would have a very high Km value of 4,215 lm/W at its peak of 490 nm; see the top plot from Figure 4 (following the description for Method 4). Here are the steps for calculating M/P ratios using that method:
- Take the measured SPD values for a light source received from a manufacturer’s laboratory test, or measure the light incident on an observer’s eye using a spectrometer.
- Multiply the value of the SPD at each wavelength by the value at the same wavelength of the melanopic efficacy function (with its maximum at 4,215 lm/W). Sum the values.
- Multiply the value of the SPD at each wavelength by the value at the same wavelength of the photopic efficacy function (with its maximum at 683 lm/W). Sum the values.
- Divide the summed melanopic lm/W by the summed photopic lm/W. This gives you the M/P 1 ratio, a ratio that is comparable to the S/P ratio used in the past.
The Km-values can be very confusing in this calculation because the resulting values of melanopic lumens and photopic lumens are not in the same range. So, here’s an alternative method, described by Sam Berman and Bob Clear in a recent IES FIRES article [2019]. They suggest a different normalization approach, then they convert the M/P value into a value with the units melanopic milliWatts per lumen:
Method 2 for calculating M/P ratios
Berman and Clear [2019] suggest a different normalization approach, and then they convert the M/P value into a value with the units melanopic milliwatts (mW) per lumen:
Normalize all sensitivity functions for all photoreceptors and V(λ), to a maximum of 1, as shown in the second plot of Figure 4. The next steps are:
- Take the measured SPD values as described in Method 1.
- Multiply the value of the SPD at each wavelength by the value at the same wavelength of the melanopic efficiency function normalized so that its maximum value is 1; this occurs at 490 nm. Sum the values to a total melanopic radiant watts. Multiply the result by 1,000, which allows reporting the value in mW.
- Multiply the value of the SPD at each wavelength by the value at the same wavelength of the photopic efficiency function normalized so that its maximum value is 1; this occurs at 555 nm. Sum the values to a total of photopic radiant watts. Then, multiply by the Km-value of 683 lm/W to get the number of lumens delivered by the SPD.
- Divide the summed melanopic radiant watts by the summed lumens. This gives you the M/P 2 ratio
Method 3 for calculating M/P ratios
Another alternative, used by the WELL Building Standard v2 [IWBI], is similar to Method 2, except that instead of normalizing the sensitivity functions to a maximum of 1, the different functions are normalized to a total area under each curve of 1 radiant watt when evaluating an equal-energy (i.e., flat) spectrum; see the third plot in Figure 4. (This is used for calculating Equivalent Melanopic Lux in the WELL Standard.) Because some of these sensitivity functions are broader than others, the maximum values don’t all align, but the areas under each curve are the same. The steps are then:
- Take the measured SPD values as described in Method 1.
- Multiply the value of the SPD at each wavelength by the value at the same wavelength of the melanopic weighting function normalized so that its area under the curve equals 1 when evaluating the equal-energy spectrum. Sum the values to get melanopic radiant watts.
- Multiply the value of the SPD at each wavelength by the value at the same wavelength of the photopic weighting function normalized so that its area under the curve when evaluating an equal-energy spectrum is 1. Sum the values to get photopic radiant watts.
- Divide the summed melanopic radiant watts by the summed photopic radiant watts. This gives you the M/P 3 ratio.
Method 4 for calculating M/P ratios
The CIE has recently recommended a fourth method for calculating M/P ratios, covered in CIE S026-2018 System for Metrology of Optical Radiation for ipRGC-Influenced Responses to Light. It is similar to Method 3, except that instead of using an equal-energy spectrum for calculating area under each sensitivity curve, it uses the standardized CIE daylight curve called D65. See the bottom plot of Figure 4. The steps are then:
- Take the measured SPD values as described in Method 1.
- Multiply the value of the SPD at each wavelength by the value at the same wavelength of the melanopic weighting function normalized so that its area under the curve equals 1 when evaluating the CIE D65 SPD. Sum the values to get melanopic radiant watts.
- Multiply the value of the SPD at each wavelength by the value at the same wavelength of the photopic weighting function normalized so that its area under the curve equals 1 when evaluating the CIE D65 SPD. Sum the values to get photopic radiant watts.
- Divide the summed melanopic radiant watts by the summed photopic radiant watts. This gives you the M/P 4 ratio, which is also called the “melanopic Daylight Equivalent Ratio” or “m-DER” by the CIE.
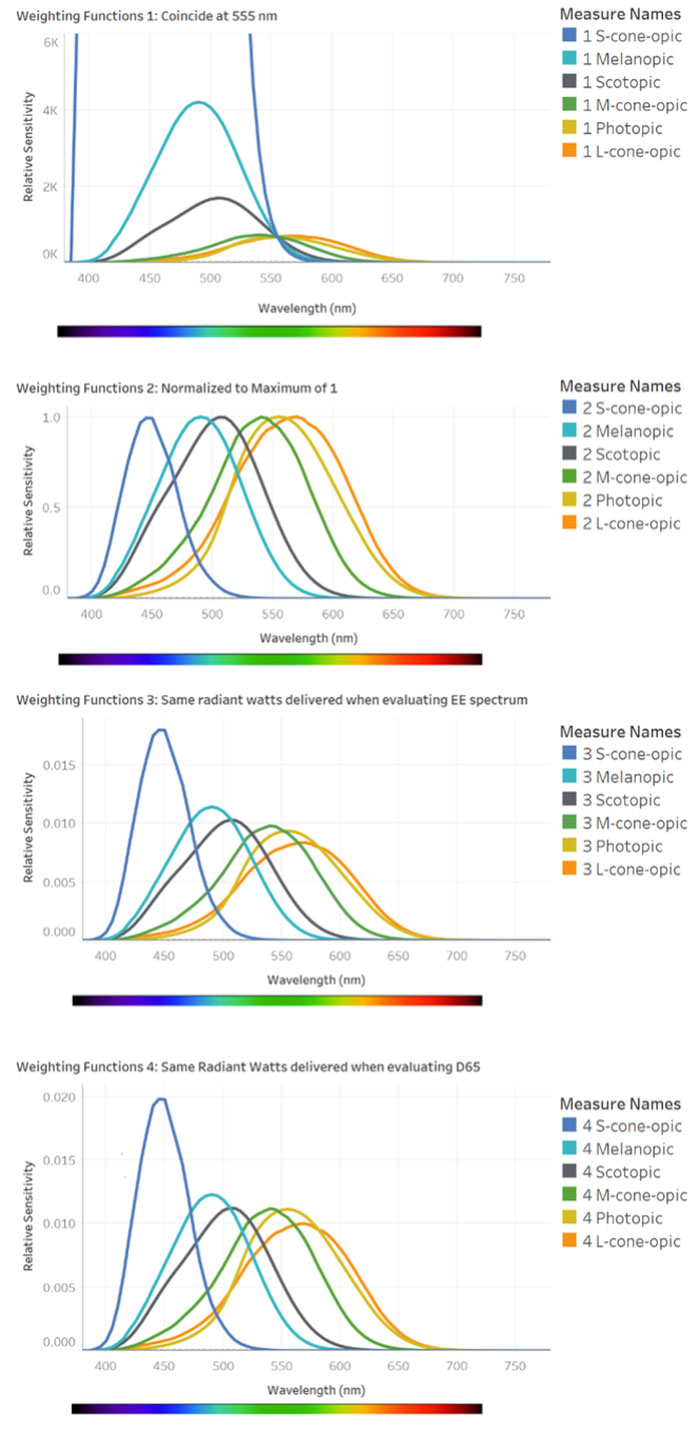
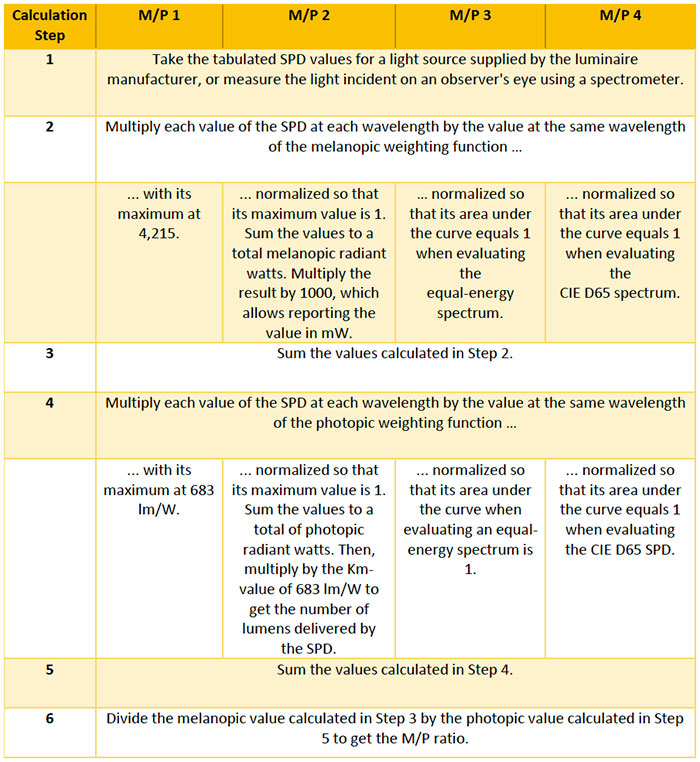
Table 1 summarizes the steps for the four methods.
Conclusion
If your head is spinning, you are justified. It is not possible to determine what a desirable or undesirable light source is based on M/P value unless you know which calculation method was used. But there’s good news. As you can see by the M/P conversion columns in Table 2, there is a constant ratio between any two of the four methods. So, you can easily translate from one method to another.
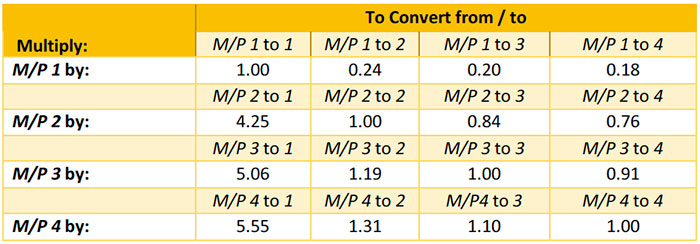
We suspect that few people will opt for M/P 1 because the numbers for melanopic “lumens” are not comparable to photopic “lumens,” and the units are not SI-compatible. Of the others, the values of Method 2 yield the highest M/P values, Method 3 the second highest values, and Method 4 the lowest values.
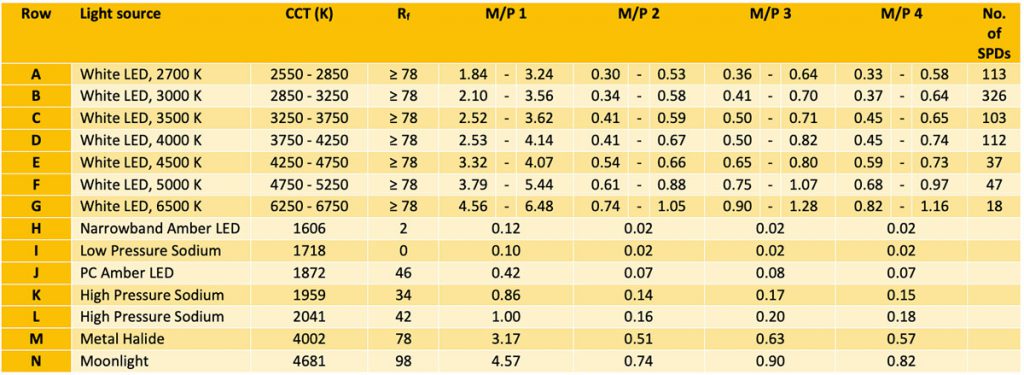
We have compiled a large number of M/P ratios using all four methods, for hundreds of real LED and conventional light sources and luminaires from a DOE database. Appendix A and Appendix B list some of these familiar sources for interior and exterior applications. (The number of LED sources was limited to those with an Rf ≥ 78, and the number of LED products included in the range is listed in the right-hand column.) It is interesting to note that there is a wide variation in M/P values for LEDs of similar CCT. This reinforces the message that CCT alone is not an adequate predictor of the M/P characteristic.
If a designer is given a target of M/P ratios >0.9 for daytime and <0.35 for nighttime, for example, it will be important that that advice is given with a specific calculation method cited. Alternatively, to reduce confusion, it makes sense to get the light and health community together to settle on a single method.
Recap:
M/P 1 is following the method taken for S/P ratios in the past, where the Km-value for the melanopic efficacy function is scaled so that the two curves coincide at 555 nm at 683 lm/W.
M/P 2 is a method using the photopic function and melanopic function normalized to a maximum of 1, but multiplying the result by 1.464 (that is, 1,000 mW/683 lm) to achieve a value of melanopic mW per lumen. This is the method suggested by Sam Berman and Bob Clear in their recent FIRES column.
M/P 3 is the method used by WELL. It normalizes the melanopic and photopic functions to the same number of radiant watts under the weighting function curves when evaluating an equal-energy spectrum.
M/P 4. Similar to M/P 3, it is the method recommended by the CIE S026-2018 document, where the melanopic and photopic functions are normalized to the same number of radiant watts under the weighting function curves when evaluating the D65 spectrum.
A note on the source for these sensitivity functions
There has been some shifting of values for the five photoreceptors in recent years. The sources used in these calculations were obtained as follows:
Excluding the melanopic, all spectral weighting functions were sourced from the Colour & Vision Research Laboratory, Institute of Ophthalmology website (cvrl.org). The L-, M-, and S-cone-opic (formerly known as erythropic [L-cone], chloropic [M-cone], and cyanopic [S-cone]) weighting functions used are the Stockman & Sharpe 10-degree fundamentals. For these, data is only provided for wavelength values 390 nm and longer; since the values approached zero nearing 390 nm, zeros were entered for values associated with wavelengths greater than or equal to 380 nm and less than 390 nm. For the S-cone-opic weighting function, the provided values ended at a wavelength of 615 nm, so a similar method was utilized, using zeros for values above 615 nm and less than or equal to 780 nm. The photopic and scotopic weighting function values used are the CIE (1924) and CIE (1951) values, respectively. The melanopic weighting function was sourced from the CIE S 026/E: 2018 document.
References
Berman SM, Clear R, 2019. Simplifying melanopsin metrology. Illuminating Engineering Society, Forum for Illumination Research, Engineering, and Science (FIRES). https://www.ies.org/fires/simplifying-melanopsin-metrology/
Berson DM, Dunn FA, Takao M. 2002. Phototransduction by retinal ganglion cells that set the circadian clock. Science 295(5557):1070-3.
[CIE] International Commission on Illumination. 1979, 1980. 16th General Conference on Weights and Measures, Resolution 3, CR, 100; 1979; and Metrologia 16(56).
[CIE] International Commission on Illumination. 2015. Report on the First International Workshop on Circadian and Neurophysiological Photometry, 2013. Vienna: CIE Technical Note 003:2015.
[CIE] International Commission on Illumination. 2018. S026-2018, System for Metrology of Optical Radiation for ipRGC-Influenced Responses to Light. Vienna.
Hattar S, Liao HW, Takao M, Berson DM, Yau KW. 2002. Melanopsin-containing retinal ganglion cells: architecture, projections, and intrinsic photosensitivity. Science 295(5557):1065-70.
Judd DB. 1951. Basic correlates of the visual stimulus in: Handbook of Experimental Physiology, chapter 22 (SS Stevens, Ed.) pp.811-867, Wiley, New York.
Kolb H, Nelson R, Fernandez E, Jones B. 2017. Webvision: The organization of the retina and visual system. Online publication. http://webvision.med.utah.edu/
Lucas RJ, Peirson SN, Berson DM, Brown TM, Cooper HM, Czeisler CA, Figueiro MG, Gamlin PD, Lockley SW, O’Hagan JB, Price LA, Provencio I, Skene DJ, Brainard GC. 2014. Measuring and using light in the melanopsin age. Trends Neurosci 37(1):1-9.
McDougal DH, Gamlin PD, 2010. The influence of intrinsically-photosensitive retinal ganglion cells on the spectral sensitivity and response dynamics of the human pupillary light reflex. Vision Research 50(1):72-87.
Rea MS, 2015. The lumen seen in a new light. Lighting Res Technol 47:259-280.
Schmidt TM, Do MTH, Dacey D, Lucas R, Hattar S, and Matynia A, 2011. Melanopsin-positive intrinsically photosensitive retinal ganglion cells: From form to function. J Neurosci 31(45):16094-16101.
Schlesselman B, Gordin M, Boxler L, Schutz J, and Berman S, Liebel B, and Clear, R, 2015. Melanopically enhanced metameric white lightings make a simulated sports field appear brighter allowing a trade-off between photopic intensity and melanopic content. Proc Illuminating Engineering Soc Annual Conf.
Sharpe LT, Stockman A, Jagla W, Jägle H, 2005. A luminous efficiency function, V*(λ), for daylight adaptation. J Vision Dec 2005, Vol.5, 3. doi:10.1167/5.11.3.
Vos JJ. 1978. Colorimetric and photometric properties of a 2° fundamental observer, Color Research & Application 3 (125).
[IWBI] International WELL Building Institute. 2018. WELL Building Standard. February 2016. Available at: http://v2.wellcertified.com/. (Accessed 2019 Nov 24).
Appendix B.
Table of M/P Ratios: Exterior Light Sources and Luminaires.
